Academics, however, like to define investment “risk” differently, averring that it is the relative volatility of a stock or portfolio of stocks – that is, their volatility as compared to that of a large universe of stocks…Employing data bases and statistical skills, these academics compute with precision the “beta” of a stock – its relative volatility in the past – and then build arcane investment and capital-allocation theories around this calculation… In fact, the true investor welcomes volatility. – Warren Buffett

Short-term volatility is not an appropriate measure of risk for investments with long time horizons. Volatility for the long term investor represents opportunity. For example, while under Warren Buffet’s control Berkshire Hathaway has seen its stock price halved on four separate occasions. Under the Efficient Market Hypothesis and the standard interpretation of volatility as risk, these events would mean that Berkshire was an extremely risky investment which lost more than half of its intrinsic value on each occasion. However, rather than indicating a high level of risk or Berkshire actually losing 50% of its underlying value, these episodes presented excellent buying opportunities. If an investor is willing to brave potentially extreme short-term fluctuations, in the long run his or her risk-return payoff has the opportunity to markedly increase.
Volatility creates Opportunity, but only if the investor has a sufficient Investment Horizon and can keep the inevitable fear during market declines in check.
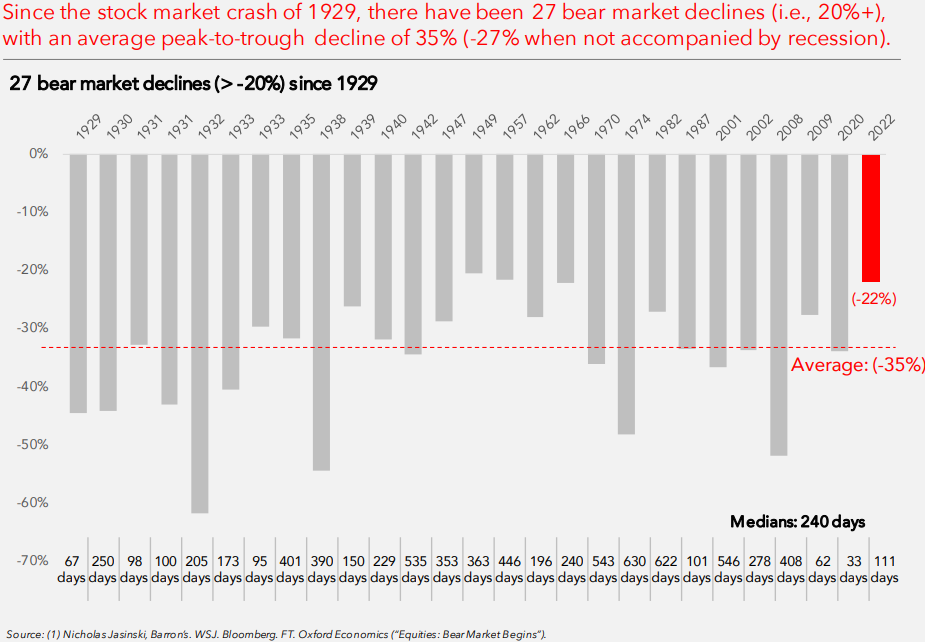
It is important to understand the difference between Risk Capacity and Tolerance. Assume you have a $2,000,000.00 portfolio and sometime over the next 5 years you suffer a 30% drawdown in a bear market. Now that $600,000.00 “loss”, which has historically been transitory given at least a 5-year investment horizon, should not affect your future lifestyle. That relates to “Risk Capacity”. However, the psychological cost of that $600,000.00 can be substantial. That is Risk Tolerance, which contributes to investors’ historical underperformance, as seen in this graphic from AdvicePeriod:

Part of our job at HCM is to make sure the above doesn’t happen to you.
Instead of volatility, HCM uses maximum drawdown as its preferred measurement of risk. To see why this is important, let’s look at OBIOX prior to its hard close on June 9th, 2017:
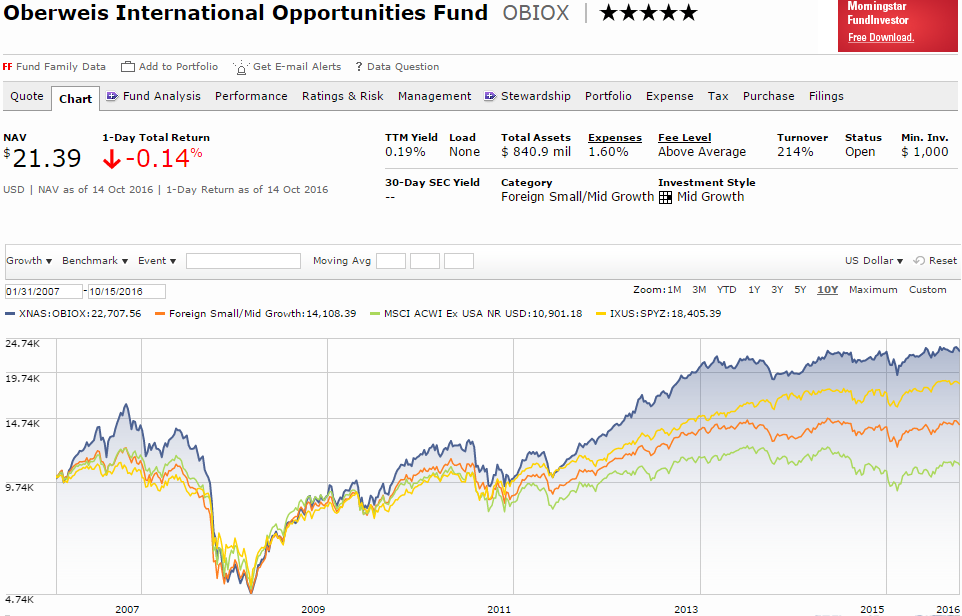
As of 5/19/16 Morningstar’s 5 star rating placed OBIOX in the top 10% of funds within its Category based on its relative risk-adjusted return over the last 3 and 5-years. The Chart compares the current value of a $10,000.00 initial investment in OBIOX ($22,707.56, blue line) to that of its average Foreign Small/Mid Growth fund peer ($14,108.39, orange line), and its MSCI ACWI excluding the US benchmark ($10,901.18, green line). We have added the S&P 500 ($18,405.39, yellow line) for comparison. Outstanding risk-adjusted relative performance resulting from a quantitative process and team that we are familiar with makes OBIOX an easy choice for HCM clients focused on Capital Appreciation with an IRA account (due to its 214% annual portfolio Turnover). But would this OEF be an appropriate investment for a client focused on Capital Preservation? How about a client transitioning from Capital Appreciation to Preservation?
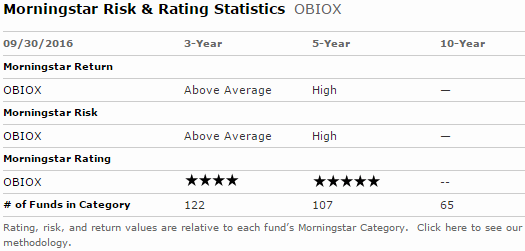
To answer those questions, we need to know how much Risk OBIOX assumed in achieving those stellar results. Morningstar provides a variety of risk metrics under their Ratings & Risk tab. The 1st of its 4 sections classifies OBIOX’s Risk, relative to that of its peers, as High over the last 5-Years, dropping to Above Average over the last 3-Years. Not very helpful. Since OBIOX’s process hasn’t changed, neither has its Risk. We need to be able to quantify OBIOX’s risk in order to determine if and to what extent it should be in a client’s portfolio.
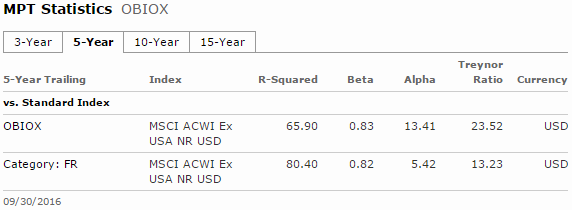
Section 2 gives us OBIOX’s Beta relative to that of its benchmark. Morningstar’s definition: “A measure of a fund’s sensitivity to market movements. The beta of the market is 1.00 by definition. Morningstar calculates beta by comparing a fund’s excess return over Treasury bills to the market’s excess return over Treasury bills, so a beta of 1.10 shows that the fund has performed 10% better than its benchmark index in up markets and 10% worse in down markets, assuming all other factors remain constant. …” Now Beta would be useful for our purpose if it was accurate during corrections (market declines of 10 to 19%) and bear markets (20% or greater declines). OBIOX’s .83 Beta implies that a 10% benchmark decline would result in a 8.3% loss. Unfortunately, as we will see, Betas aren’t accurate during significant market declines.
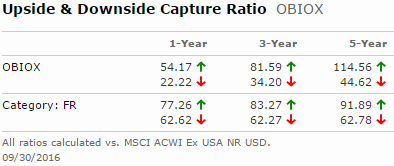
Section 4 provides us with OBIOX’s Downside Capture Ratio. Morningstar’s definition: “Upside/downside capture ratio show you whether a given fund has outperformed–gained more or lost less than–a broad market benchmark during periods of market strength and weakness, and if so, by how much. … Downside capture ratios are calculated by taking the fund’s monthly return during the periods of negative benchmark performance and dividing it by the benchmark return. Morningstar.com displays the upside and downside capture ratios over one-, three-, five-, 10-, and 15-year periods by calculating the geometric average for both the fund and index returns during the up and down months, respectively, over each time period. … a downside capture ratio of less than 100 indicates that a fund has lost less than its benchmark in periods when the benchmark has been in the red. All stock funds’ upside and downside capture ratios are calculated versus the S&P 500, whereas … international funds’ ratios are calculated relative to the … MSCI EAFE Index, respectively. For some context, we also show the category average upside/downside capture ratios for those same time periods.” According to OBIOX’s excellent 5-Year Downside Capture Ratio of 44.62 (the 1 and 3-Year Ratios being even better), that same 10% market correction should result in only a 4.5% loss. If only it was true. Like with Beta, averaging a stock’s movement relative to a benchmark during normal market volatility masks the fund’s performance during corrections and bear markets.
Our solution is to calculate Maximum Drawdown relative to the S&P 500 during corrections and bear markets for every Fund we recommend. Since the secular Bull Market peak on 10/9/07 the S&P 500 has experienced the 2nd largest Bear Market in history and 2 Corrections. OBIOX’s Maximum Drawdowns during those declines are provided along with their ratio to the S&P 500.
“When Wall Street catches a cold, the rest of the world catches pneumonia.” is one version of a common saying. It certainly appears to be true relative to OBIOX’s MSCI benchmark, and our benchmark, the Morgan Stanley Capital International All Country World Index All Cap (MSCI ACWI AC).
So when designing a portfolio for a client whose Risk Capacity and/or Tolerance need to be considered, it is Maximum Drawdown that should matter. We will usually recommend that the level of risk be lowered each 5 years during retirement. Whether a fund like OBIOX is included in the portfolio depends on the client’s Risk Profile, and that will usually change over time.
